Telemetry over gRPC Clear Channel
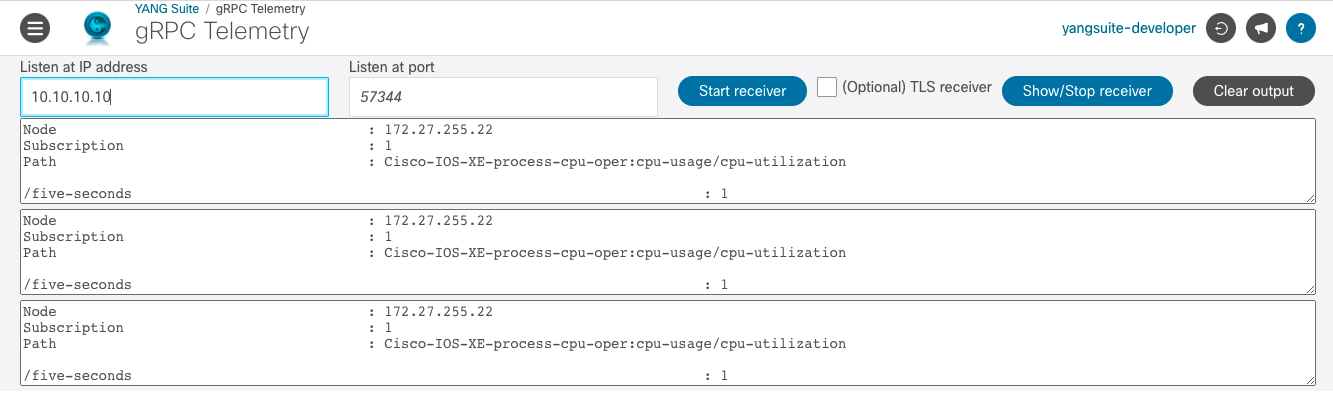
Enter the IP address on the YANG Suite server recieving the stream and the port number you wish it to listen on, then click “Start receiver”. You may configure multiple receivers.
Configure your router telemetry subscriptions to send streams to each configured receiver IP address/port running on the YANG Suite server and you will begin to see the telemetry messages with the subcription ID appearing on the page as they are received by YANG Suite.
Below is an example of how to configure a telemetry subscription on your router. Refer to the device user manual for details of the config.
telemetry ietf subscription 1
encoding encode-kvgpb
filter xpath /process-cpu-ios-xe-oper:cpu-usage/cpu-utilization/five-seconds
source-address 172.27.255.22
source-vrf Mgmt-vrf
stream yang-push
update-policy periodic 2000
receiver ip address 10.10.10.10 57344 protocol grpc-tcp
See figure below.
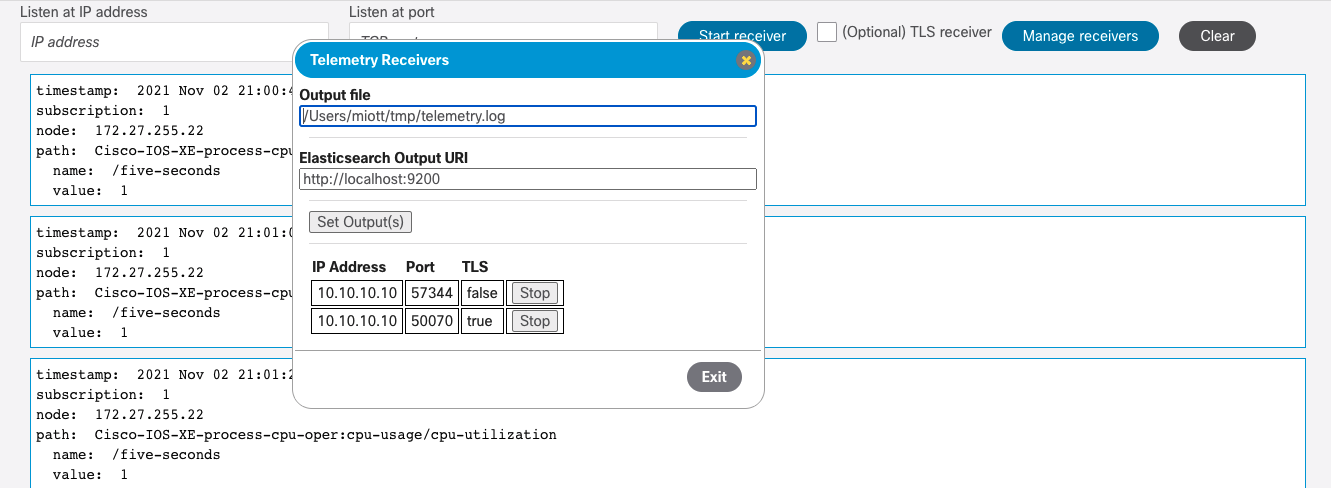
Managing receiver start/stop and output
Click on “Manage receiver” to see what receivers are live on the YANG Suite server. By default, all telemetry messages are sent to the YANG Suite web page. There are also choices to send the output to a file and/or a running instance of Elasticsearch. For file output, enter the full path of the file targeted for output. The directory must exist, however, the file will be created if it does not exist or appeded if it does. To send the output to [Elasticsearch], enter the URI where it is running. Click on “Set output(s)” to begin optional output target. Click on the “Stop” button next to the receiver you wish to stop.