Class latency:LatencyHist51year (CONCRETE)

Class ID:9713
Class Label: current delay(histogram mode-5) stats in 1 year
Encrypted: false - Exportable: false - Persistent: false - Configurable: false - Subject to Quota: Disabled
Write Access: [NON CONFIGURABLE]
Read Access: [admin, fabric-connectivity-mgmt, fabric-connectivity-util, fabric-equipment, ops]
Creatable/Deletable: no (see Container Mos for details)
Semantic Scope: None
Semantic Scope Evaluation Rule: Parent
Monitoring Policy Source: Parent
Monitoring Flags : [ IsObservable: false, HasStats: false, HasFaults: false, HasHealth: false, HasEventRules: false ]

A class that represents the most current statistics for delay(histogram mode-5) in a 1 year sampling interval. This class updates every day.

Naming Rules
RN FORMAT: CDlatencyLatencyHist51year

    [1] PREFIX=CDlatencyLatencyHist51year


DN FORMAT: 

[0] dbgs/logcont/latpath-{srcNodeId}-{srcNodeId2}-to-{dstNodeId}/CDlatencyLatencyHist51year

[1] topology/pod-{id}/node-{id}/ndbgs/logcont/latpath-{srcNodeId}-{srcNodeId2}-to-{dstNodeId}/CDlatencyLatencyHist51year

[2] ndbgs/logcont/latpath-{srcNodeId}-{srcNodeId2}-to-{dstNodeId}/CDlatencyLatencyHist51year


Diagram

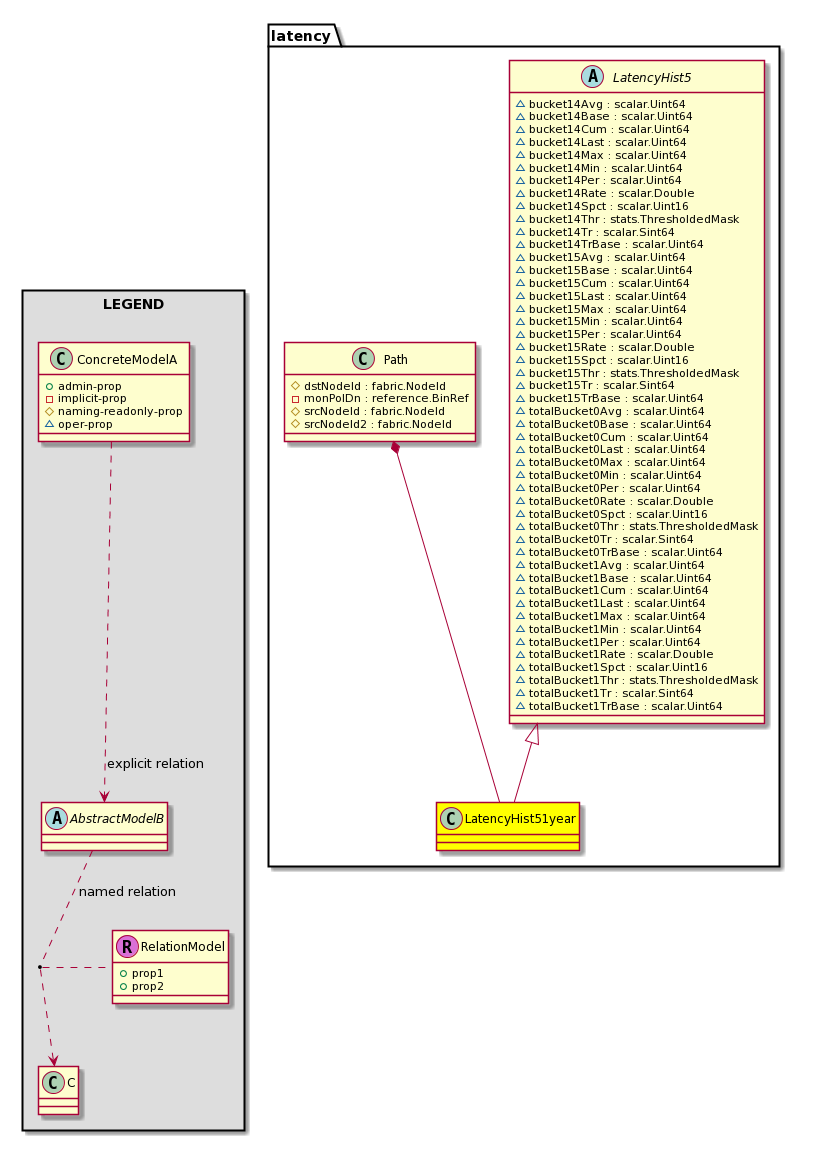
Super Mo: latency:LatencyHist5,
Container Mos: latency:Path (deletable:no),


Containers Hierarchies
[V] top:Root  This class represents the root element in the object hierarchy. All managed objects in the system are descendants of the Root element.
 ├
[V] dbg:Cont IFC level debug apparatus container.
 
 ├
[V] latency:OnGoingCont  Top-level container for On-Going latency
 
 
 ├
[V] latency:Path  MOs containing latency data for path including VPC


 ├
[V] latency:LatencyHist51year A class that represents the most current statistics for delay(histogram mode-5) in a 1 year sampling interval. This class updates every day.
[V] top:Root  This class represents the root element in the object hierarchy. All managed objects in the system are descendants of the Root element.
 ├
[V] fabric:Topology The root for IFC topology.
 
 ├
[V] fabric:Pod A pod.
 
 
 ├
[V] fabric:Node The root node for the APIC.


 ├
[V] dbg:NDbgs The node debugs.


 ├
[V] latency:OnGoingCont  Top-level container for On-Going latency


 ├
[V] latency:Path  MOs containing latency data for path including VPC


 ├
[V] latency:LatencyHist51year A class that represents the most current statistics for delay(histogram mode-5) in a 1 year sampling interval. This class updates every day.
[V] top:Root  This class represents the root element in the object hierarchy. All managed objects in the system are descendants of the Root element.
 ├
[V] dbg:NDbgs The node debugs.
 
 ├
[V] latency:OnGoingCont  Top-level container for On-Going latency
 
 
 ├
[V] latency:Path  MOs containing latency data for path including VPC


 ├
[V] latency:LatencyHist51year A class that represents the most current statistics for delay(histogram mode-5) in a 1 year sampling interval. This class updates every day.


Contained Hierarchy
[V] latency:LatencyHist51year A class that represents the most current statistics for delay(histogram mode-5) in a 1 year sampling interval. This class updates every day.


Inheritance
[V] stats:Item The superclass for current and historical data of the statistics.
 ├
[V] stats:Curr The superclass for the current data objects of the statistics.
 
 ├
[V] latency:LatencyHist5 A super class that represents the most current statistics for delay(histogram mode-5).
 
 
 ├
[V] latency:LatencyHist51year A class that represents the most current statistics for delay(histogram mode-5) in a 1 year sampling interval. This class updates every day.


Stat Counters
scalar:Uint64 COUNTER: latency:LatencyHist5:totalBucket1(packets)
           packets within the 2nd bucket
          Comments: totalBucket1(Total no of packets with latency falling in the 2nd bucket range )
scalar:Uint64 COUNTER: latency:LatencyHist5:totalBucket0(packets)
           packets within the 1st bucket
          Comments: totalBucket0(Total no of packets with latency falling in the 1st bucket range )
scalar:Uint64 COUNTER: latency:LatencyHist5:bucket15(packets)
           packets within the 16th bucket
          Comments: Bucket15(number of packets with latency falling in the 16th bucket range )
scalar:Uint64 COUNTER: latency:LatencyHist5:bucket14(packets)
           packets within the 15th bucket
          Comments: Bucket14(number of packets with latency falling in the 15th bucket range )


Events


Faults


Fsms


Stats Info


Properties Summary
Defined in: latency:LatencyHist5
scalar:Uint64 bucket14Avg  (latency:LatencyHist5:bucket14Avg)
           Packets within the 15th bucket. This is the average value read by the counter during the collection interval. Note that this value resets to 0 at the beginning of each interval.
scalar:Uint64 bucket14Base  (latency:LatencyHist5:bucket14Base)
           Packets within the 15th bucket. This is the cumulative value of the counter after the last reset of the hardware counter. Note that this value continues through each interval without resetting to zero. Used for internal purposes.
scalar:Uint64 bucket14Cum  (latency:LatencyHist5:bucket14Cum)
           Packets within the 15th bucket. The total sum of the values read. Note that this value continues through each interval without resetting to zero.
scalar:Uint64 bucket14Last  (latency:LatencyHist5:bucket14Last)
           Packets within the 15th bucket. This is the most current value read by the counter.
scalar:Uint64 bucket14Max  (latency:LatencyHist5:bucket14Max)
           Packets within the 15th bucket. This is the largest value read by the counter during the collection interval. This value is only overwritten if the most current value is larger than the previous value. For example, if the value of the first reading is 3 and the value of the second reading is 4, the previous value is overwritten with 4. If the third reading is smaller than 4, the value remains at 4. Note that this value resets to 0 at the beginning of each interval.
scalar:Uint64 bucket14Min  (latency:LatencyHist5:bucket14Min)
           Packets within the 15th bucket. This is the smallest value read by the counter during the collection interval. This value is only overwritten if the most current value is smaller than the previous value. For example, if the value of the first reading is 3 and the value of the second reading is 2, the previous value is overwritten with 2. If the third reading is larger than 2, the value remains at 2. Note that this value resets to 0 at the beginning of each interval.
scalar:Uint64 bucket14Per  (latency:LatencyHist5:bucket14Per)
           Packets within the 15th bucket. The total sum of the values read during the collection interval. Note that this value resets to 0 at the beginning of each interval.
scalar:Double bucket14Rate  (latency:LatencyHist5:bucket14Rate)
           Packets within the 15th bucket. This is the rate of the counter during the collection interval. The rate is calculated by dividing the periodic value by the length of the collection interval. Note that this value resets to 0 at the beginning of each interval.
scalar:Uint16 bucket14Spct  (latency:LatencyHist5:bucket14Spct)
           Packets within the 15th bucket. This is the number of missed and/or incorrect values read by the counter during the collection interval. Note that this value resets to 0 at the beginning of each interval.
stats:ThresholdedMask
          scalar:Bitmask64
bucket14Thr  (latency:LatencyHist5:bucket14Thr)
           Packets within the 15th bucket. This indicates the properties of the counter that crossed the threshold during the collection interval. Note that this value resets at the beginning of each interval.
scalar:Sint64 bucket14Tr  (latency:LatencyHist5:bucket14Tr)
           Packets within the 15th bucket. This is the trending value of the counter. Note that this value resets to 0 at the beginning of each interval.
scalar:Uint64 bucket14TrBase  (latency:LatencyHist5:bucket14TrBase)
           Packets within the 15th bucket. This is the cumulative value of the counter from the previous collection interval. Used for internal purposes.
scalar:Uint64 bucket15Avg  (latency:LatencyHist5:bucket15Avg)
           Packets within the 16th bucket. This is the average value read by the counter during the collection interval. Note that this value resets to 0 at the beginning of each interval.
scalar:Uint64 bucket15Base  (latency:LatencyHist5:bucket15Base)
           Packets within the 16th bucket. This is the cumulative value of the counter after the last reset of the hardware counter. Note that this value continues through each interval without resetting to zero. Used for internal purposes.
scalar:Uint64 bucket15Cum  (latency:LatencyHist5:bucket15Cum)
           Packets within the 16th bucket. The total sum of the values read. Note that this value continues through each interval without resetting to zero.
scalar:Uint64 bucket15Last  (latency:LatencyHist5:bucket15Last)
           Packets within the 16th bucket. This is the most current value read by the counter.
scalar:Uint64 bucket15Max  (latency:LatencyHist5:bucket15Max)
           Packets within the 16th bucket. This is the largest value read by the counter during the collection interval. This value is only overwritten if the most current value is larger than the previous value. For example, if the value of the first reading is 3 and the value of the second reading is 4, the previous value is overwritten with 4. If the third reading is smaller than 4, the value remains at 4. Note that this value resets to 0 at the beginning of each interval.
scalar:Uint64 bucket15Min  (latency:LatencyHist5:bucket15Min)
           Packets within the 16th bucket. This is the smallest value read by the counter during the collection interval. This value is only overwritten if the most current value is smaller than the previous value. For example, if the value of the first reading is 3 and the value of the second reading is 2, the previous value is overwritten with 2. If the third reading is larger than 2, the value remains at 2. Note that this value resets to 0 at the beginning of each interval.
scalar:Uint64 bucket15Per  (latency:LatencyHist5:bucket15Per)
           Packets within the 16th bucket. The total sum of the values read during the collection interval. Note that this value resets to 0 at the beginning of each interval.
scalar:Double bucket15Rate  (latency:LatencyHist5:bucket15Rate)
           Packets within the 16th bucket. This is the rate of the counter during the collection interval. The rate is calculated by dividing the periodic value by the length of the collection interval. Note that this value resets to 0 at the beginning of each interval.
scalar:Uint16 bucket15Spct  (latency:LatencyHist5:bucket15Spct)
           Packets within the 16th bucket. This is the number of missed and/or incorrect values read by the counter during the collection interval. Note that this value resets to 0 at the beginning of each interval.
stats:ThresholdedMask
          scalar:Bitmask64
bucket15Thr  (latency:LatencyHist5:bucket15Thr)
           Packets within the 16th bucket. This indicates the properties of the counter that crossed the threshold during the collection interval. Note that this value resets at the beginning of each interval.
scalar:Sint64 bucket15Tr  (latency:LatencyHist5:bucket15Tr)
           Packets within the 16th bucket. This is the trending value of the counter. Note that this value resets to 0 at the beginning of each interval.
scalar:Uint64 bucket15TrBase  (latency:LatencyHist5:bucket15TrBase)
           Packets within the 16th bucket. This is the cumulative value of the counter from the previous collection interval. Used for internal purposes.
scalar:Uint64 totalBucket0Avg  (latency:LatencyHist5:totalBucket0Avg)
           Packets within the 1st bucket. This is the average value read by the counter during the collection interval. Note that this value resets to 0 at the beginning of each interval.
scalar:Uint64 totalBucket0Base  (latency:LatencyHist5:totalBucket0Base)
           Packets within the 1st bucket. This is the cumulative value of the counter after the last reset of the hardware counter. Note that this value continues through each interval without resetting to zero. Used for internal purposes.
scalar:Uint64 totalBucket0Cum  (latency:LatencyHist5:totalBucket0Cum)
           Packets within the 1st bucket. The total sum of the values read. Note that this value continues through each interval without resetting to zero.
scalar:Uint64 totalBucket0Last  (latency:LatencyHist5:totalBucket0Last)
           Packets within the 1st bucket. This is the most current value read by the counter.
scalar:Uint64 totalBucket0Max  (latency:LatencyHist5:totalBucket0Max)
           Packets within the 1st bucket. This is the largest value read by the counter during the collection interval. This value is only overwritten if the most current value is larger than the previous value. For example, if the value of the first reading is 3 and the value of the second reading is 4, the previous value is overwritten with 4. If the third reading is smaller than 4, the value remains at 4. Note that this value resets to 0 at the beginning of each interval.
scalar:Uint64 totalBucket0Min  (latency:LatencyHist5:totalBucket0Min)
           Packets within the 1st bucket. This is the smallest value read by the counter during the collection interval. This value is only overwritten if the most current value is smaller than the previous value. For example, if the value of the first reading is 3 and the value of the second reading is 2, the previous value is overwritten with 2. If the third reading is larger than 2, the value remains at 2. Note that this value resets to 0 at the beginning of each interval.
scalar:Uint64 totalBucket0Per  (latency:LatencyHist5:totalBucket0Per)
           Packets within the 1st bucket. The total sum of the values read during the collection interval. Note that this value resets to 0 at the beginning of each interval.
scalar:Double totalBucket0Rate  (latency:LatencyHist5:totalBucket0Rate)
           Packets within the 1st bucket. This is the rate of the counter during the collection interval. The rate is calculated by dividing the periodic value by the length of the collection interval. Note that this value resets to 0 at the beginning of each interval.
scalar:Uint16 totalBucket0Spct  (latency:LatencyHist5:totalBucket0Spct)
           Packets within the 1st bucket. This is the number of missed and/or incorrect values read by the counter during the collection interval. Note that this value resets to 0 at the beginning of each interval.
stats:ThresholdedMask
          scalar:Bitmask64
totalBucket0Thr  (latency:LatencyHist5:totalBucket0Thr)
           Packets within the 1st bucket. This indicates the properties of the counter that crossed the threshold during the collection interval. Note that this value resets at the beginning of each interval.
scalar:Sint64 totalBucket0Tr  (latency:LatencyHist5:totalBucket0Tr)
           Packets within the 1st bucket. This is the trending value of the counter. Note that this value resets to 0 at the beginning of each interval.
scalar:Uint64 totalBucket0TrBase  (latency:LatencyHist5:totalBucket0TrBase)
           Packets within the 1st bucket. This is the cumulative value of the counter from the previous collection interval. Used for internal purposes.
scalar:Uint64 totalBucket1Avg  (latency:LatencyHist5:totalBucket1Avg)
           Packets within the 2nd bucket. This is the average value read by the counter during the collection interval. Note that this value resets to 0 at the beginning of each interval.
scalar:Uint64 totalBucket1Base  (latency:LatencyHist5:totalBucket1Base)
           Packets within the 2nd bucket. This is the cumulative value of the counter after the last reset of the hardware counter. Note that this value continues through each interval without resetting to zero. Used for internal purposes.
scalar:Uint64 totalBucket1Cum  (latency:LatencyHist5:totalBucket1Cum)
           Packets within the 2nd bucket. The total sum of the values read. Note that this value continues through each interval without resetting to zero.
scalar:Uint64 totalBucket1Last  (latency:LatencyHist5:totalBucket1Last)
           Packets within the 2nd bucket. This is the most current value read by the counter.
scalar:Uint64 totalBucket1Max  (latency:LatencyHist5:totalBucket1Max)
           Packets within the 2nd bucket. This is the largest value read by the counter during the collection interval. This value is only overwritten if the most current value is larger than the previous value. For example, if the value of the first reading is 3 and the value of the second reading is 4, the previous value is overwritten with 4. If the third reading is smaller than 4, the value remains at 4. Note that this value resets to 0 at the beginning of each interval.
scalar:Uint64 totalBucket1Min  (latency:LatencyHist5:totalBucket1Min)
           Packets within the 2nd bucket. This is the smallest value read by the counter during the collection interval. This value is only overwritten if the most current value is smaller than the previous value. For example, if the value of the first reading is 3 and the value of the second reading is 2, the previous value is overwritten with 2. If the third reading is larger than 2, the value remains at 2. Note that this value resets to 0 at the beginning of each interval.
scalar:Uint64 totalBucket1Per  (latency:LatencyHist5:totalBucket1Per)
           Packets within the 2nd bucket. The total sum of the values read during the collection interval. Note that this value resets to 0 at the beginning of each interval.
scalar:Double totalBucket1Rate  (latency:LatencyHist5:totalBucket1Rate)
           Packets within the 2nd bucket. This is the rate of the counter during the collection interval. The rate is calculated by dividing the periodic value by the length of the collection interval. Note that this value resets to 0 at the beginning of each interval.
scalar:Uint16 totalBucket1Spct  (latency:LatencyHist5:totalBucket1Spct)
           Packets within the 2nd bucket. This is the number of missed and/or incorrect values read by the counter during the collection interval. Note that this value resets to 0 at the beginning of each interval.
stats:ThresholdedMask
          scalar:Bitmask64
totalBucket1Thr  (latency:LatencyHist5:totalBucket1Thr)
           Packets within the 2nd bucket. This indicates the properties of the counter that crossed the threshold during the collection interval. Note that this value resets at the beginning of each interval.
scalar:Sint64 totalBucket1Tr  (latency:LatencyHist5:totalBucket1Tr)
           Packets within the 2nd bucket. This is the trending value of the counter. Note that this value resets to 0 at the beginning of each interval.
scalar:Uint64 totalBucket1TrBase  (latency:LatencyHist5:totalBucket1TrBase)
           Packets within the 2nd bucket. This is the cumulative value of the counter from the previous collection interval. Used for internal purposes.
Defined in: stats:Item
scalar:Uint16 cnt  (stats:Item:cnt)
           The number of readings made within the current sample.
scalar:Uint32 lastCollOffset  (stats:Item:lastCollOffset)
          
scalar:Date repIntvEnd  (stats:Item:repIntvEnd)
          
scalar:Date repIntvStart  (stats:Item:repIntvStart)
          
Defined in: mo:TopProps
mo:ModificationChildAction
          scalar:Bitmask32
childAction  (mo:TopProps:childAction)
           Delete or ignore. For internal use only.
reference:BinRef dn  (mo:TopProps:dn)
           A tag or metadata is a non-hierarchical keyword or term assigned to the fabric module.
reference:BinRN rn  (mo:TopProps:rn)
           Identifies an object from its siblings within the context of its parent object. The distinguished name contains a sequence of relative names.
mo:ModificationStatus
          scalar:Bitmask32
status  (mo:TopProps:status)
           The upgrade status. This property is for internal use only.
Defined in: mo:Modifiable
mo:TStamp
          scalar:Date
modTs  (mo:Modifiable:modTs)
           The time when this object was last modified.
Properties Detail

bucket14Avg

Type: scalar:Uint64

Units: packets
Encrypted: false
Access: oper
Category: ImplicitAvg
    Comments:
Packets within the 15th bucket. This is the average value read by the counter during the collection interval. Note that this value resets to 0 at the beginning of each interval.


bucket14Base

Type: scalar:Uint64

Units: packets
Encrypted: false
Access: oper
Category: ImplicitBaseline
    Comments:
Packets within the 15th bucket. This is the cumulative value of the counter after the last reset of the hardware counter. Note that this value continues through each interval without resetting to zero. Used for internal purposes.


bucket14Cum

Type: scalar:Uint64

Units: packets
Encrypted: false
Access: oper
Category: ImplicitCumulative
    Comments:
Packets within the 15th bucket. The total sum of the values read. Note that this value continues through each interval without resetting to zero.


bucket14Last

Type: scalar:Uint64

Units: packets
Encrypted: false
Access: oper
Category: ImplicitLastReading
    Comments:
Packets within the 15th bucket. This is the most current value read by the counter.


bucket14Max

Type: scalar:Uint64

Units: packets
Encrypted: false
Access: oper
Category: ImplicitMax
    Comments:
Packets within the 15th bucket. This is the largest value read by the counter during the collection interval. This value is only overwritten if the most current value is larger than the previous value. For example, if the value of the first reading is 3 and the value of the second reading is 4, the previous value is overwritten with 4. If the third reading is smaller than 4, the value remains at 4. Note that this value resets to 0 at the beginning of each interval.


bucket14Min

Type: scalar:Uint64

Units: packets
Encrypted: false
Access: oper
Category: ImplicitMin
    Comments:
Packets within the 15th bucket. This is the smallest value read by the counter during the collection interval. This value is only overwritten if the most current value is smaller than the previous value. For example, if the value of the first reading is 3 and the value of the second reading is 2, the previous value is overwritten with 2. If the third reading is larger than 2, the value remains at 2. Note that this value resets to 0 at the beginning of each interval.


bucket14Per

Type: scalar:Uint64

Units: packets
Encrypted: false
Access: oper
Category: ImplicitPeriodic
    Comments:
Packets within the 15th bucket. The total sum of the values read during the collection interval. Note that this value resets to 0 at the beginning of each interval.


bucket14Rate

Type: scalar:Double

Units: packets
Encrypted: false
Access: oper
Category: ImplicitRate
    Comments:
Packets within the 15th bucket. This is the rate of the counter during the collection interval. The rate is calculated by dividing the periodic value by the length of the collection interval. Note that this value resets to 0 at the beginning of each interval.


bucket14Spct

Type: scalar:Uint16

Units: packets
Encrypted: false
Access: oper
Category: ImplicitSuspect
    Comments:
Packets within the 15th bucket. This is the number of missed and/or incorrect values read by the counter during the collection interval. Note that this value resets to 0 at the beginning of each interval.


bucket14Thr

Type: stats:ThresholdedMask
Primitive Type: scalar:Bitmask64

Units: packets
Encrypted: false
Access: oper
Category: ImplicitThresholded
    Comments:
Packets within the 15th bucket. This indicates the properties of the counter that crossed the threshold during the collection interval. Note that this value resets at the beginning of each interval.
Constants
unspecified 0ull --- NO COMMENTS
cumulativeWarn 1024ull cumulative severity warning NO COMMENTS
periodicCrit 1048576ull periodic severity critical NO COMMENTS
maxLow 1073741824ull max crossed low threshold NO COMMENTS
avgMajor 1099511627776ull avg severity major NO COMMENTS
rateHigh 1125899906842624ull rate crossed high threshold NO COMMENTS
cumulativeRecovering 128ull cumulative recovering NO COMMENTS
periodicWarn 131072ull periodic severity warning NO COMMENTS
minCrit 134217728ull min severity critical NO COMMENTS
avgLow 137438953472ull avg crossed low threshold NO COMMENTS
trendMajor 140737488355328ull trend severity major NO COMMENTS
periodicRecovering 16384ull periodic recovering NO COMMENTS
minWarn 16777216ull min severity warning NO COMMENTS
lastReadingMinor 16ull lastReading severity minor NO COMMENTS
maxCrit 17179869184ull max severity critical NO COMMENTS
trendLow 17592186044416ull trend crossed low threshold NO COMMENTS
rateMajor 18014398509481984ull rate severity major NO COMMENTS
lastReadingRecovering 1ull lastReading recovering NO COMMENTS
cumulativeMinor 2048ull cumulative severity minor NO COMMENTS
minRecovering 2097152ull min recovering NO COMMENTS
maxWarn 2147483648ull max severity warning NO COMMENTS
avgCrit 2199023255552ull avg severity critical NO COMMENTS
rateLow 2251799813685248ull rate crossed low threshold NO COMMENTS
cumulativeHigh 256ull cumulative crossed high threshold NO COMMENTS
periodicMinor 262144ull periodic severity minor NO COMMENTS
maxRecovering 268435456ull max recovering NO COMMENTS
avgWarn 274877906944ull avg severity warning NO COMMENTS
trendCrit 281474976710656ull trend severity critical NO COMMENTS
lastReadingHigh 2ull lastReading crossed high threshold NO COMMENTS
periodicHigh 32768ull periodic crossed high threshold NO COMMENTS
lastReadingMajor 32ull lastReading severity major NO COMMENTS
minMinor 33554432ull min severity minor NO COMMENTS
avgRecovering 34359738368ull avg recovering NO COMMENTS
trendWarn 35184372088832ull trend severity warning NO COMMENTS
rateCrit 36028797018963968ull rate severity critical NO COMMENTS
cumulativeMajor 4096ull cumulative severity major NO COMMENTS
minHigh 4194304ull min crossed high threshold NO COMMENTS
maxMinor 4294967296ull max severity minor NO COMMENTS
trendRecovering 4398046511104ull trend recovering NO COMMENTS
rateWarn 4503599627370496ull rate severity warning NO COMMENTS
lastReadingLow 4ull lastReading crossed low threshold NO COMMENTS
cumulativeLow 512ull cumulative crossed low threshold NO COMMENTS
periodicMajor 524288ull periodic severity major NO COMMENTS
maxHigh 536870912ull max crossed high threshold NO COMMENTS
avgMinor 549755813888ull avg severity minor NO COMMENTS
rateRecovering 562949953421312ull rate recovering NO COMMENTS
lastReadingCrit 64ull lastReading severity critical NO COMMENTS
periodicLow 65536ull periodic crossed low threshold NO COMMENTS
minMajor 67108864ull min severity major NO COMMENTS
avgHigh 68719476736ull avg crossed high threshold NO COMMENTS
trendMinor 70368744177664ull trend severity minor NO COMMENTS
cumulativeCrit 8192ull cumulative severity critical NO COMMENTS
minLow 8388608ull min crossed low threshold NO COMMENTS
maxMajor 8589934592ull max severity major NO COMMENTS
trendHigh 8796093022208ull trend crossed high threshold NO COMMENTS
lastReadingWarn 8ull lastReading severity warning NO COMMENTS
rateMinor 9007199254740992ull rate severity minor NO COMMENTS
DEFAULT unspecified(0ull) --- NO COMMENTS


bucket14Tr

Type: scalar:Sint64

Units: packets
Encrypted: false
Access: oper
Category: ImplicitTrend
    Comments:
Packets within the 15th bucket. This is the trending value of the counter. Note that this value resets to 0 at the beginning of each interval.


bucket14TrBase

Type: scalar:Uint64

Units: packets
Encrypted: false
Access: oper
Category: ImplicitTrendBase
    Comments:
Packets within the 15th bucket. This is the cumulative value of the counter from the previous collection interval. Used for internal purposes.


bucket15Avg

Type: scalar:Uint64

Units: packets
Encrypted: false
Access: oper
Category: ImplicitAvg
    Comments:
Packets within the 16th bucket. This is the average value read by the counter during the collection interval. Note that this value resets to 0 at the beginning of each interval.


bucket15Base

Type: scalar:Uint64

Units: packets
Encrypted: false
Access: oper
Category: ImplicitBaseline
    Comments:
Packets within the 16th bucket. This is the cumulative value of the counter after the last reset of the hardware counter. Note that this value continues through each interval without resetting to zero. Used for internal purposes.


bucket15Cum

Type: scalar:Uint64

Units: packets
Encrypted: false
Access: oper
Category: ImplicitCumulative
    Comments:
Packets within the 16th bucket. The total sum of the values read. Note that this value continues through each interval without resetting to zero.


bucket15Last

Type: scalar:Uint64

Units: packets
Encrypted: false
Access: oper
Category: ImplicitLastReading
    Comments:
Packets within the 16th bucket. This is the most current value read by the counter.


bucket15Max

Type: scalar:Uint64

Units: packets
Encrypted: false
Access: oper
Category: ImplicitMax
    Comments:
Packets within the 16th bucket. This is the largest value read by the counter during the collection interval. This value is only overwritten if the most current value is larger than the previous value. For example, if the value of the first reading is 3 and the value of the second reading is 4, the previous value is overwritten with 4. If the third reading is smaller than 4, the value remains at 4. Note that this value resets to 0 at the beginning of each interval.


bucket15Min

Type: scalar:Uint64

Units: packets
Encrypted: false
Access: oper
Category: ImplicitMin
    Comments:
Packets within the 16th bucket. This is the smallest value read by the counter during the collection interval. This value is only overwritten if the most current value is smaller than the previous value. For example, if the value of the first reading is 3 and the value of the second reading is 2, the previous value is overwritten with 2. If the third reading is larger than 2, the value remains at 2. Note that this value resets to 0 at the beginning of each interval.


bucket15Per

Type: scalar:Uint64

Units: packets
Encrypted: false
Access: oper
Category: ImplicitPeriodic
    Comments:
Packets within the 16th bucket. The total sum of the values read during the collection interval. Note that this value resets to 0 at the beginning of each interval.


bucket15Rate

Type: scalar:Double

Units: packets
Encrypted: false
Access: oper
Category: ImplicitRate
    Comments:
Packets within the 16th bucket. This is the rate of the counter during the collection interval. The rate is calculated by dividing the periodic value by the length of the collection interval. Note that this value resets to 0 at the beginning of each interval.


bucket15Spct

Type: scalar:Uint16

Units: packets
Encrypted: false
Access: oper
Category: ImplicitSuspect
    Comments:
Packets within the 16th bucket. This is the number of missed and/or incorrect values read by the counter during the collection interval. Note that this value resets to 0 at the beginning of each interval.


bucket15Thr

Type: stats:ThresholdedMask
Primitive Type: scalar:Bitmask64

Units: packets
Encrypted: false
Access: oper
Category: ImplicitThresholded
    Comments:
Packets within the 16th bucket. This indicates the properties of the counter that crossed the threshold during the collection interval. Note that this value resets at the beginning of each interval.
Constants
unspecified 0ull --- NO COMMENTS
cumulativeWarn 1024ull cumulative severity warning NO COMMENTS
periodicCrit 1048576ull periodic severity critical NO COMMENTS
maxLow 1073741824ull max crossed low threshold NO COMMENTS
avgMajor 1099511627776ull avg severity major NO COMMENTS
rateHigh 1125899906842624ull rate crossed high threshold NO COMMENTS
cumulativeRecovering 128ull cumulative recovering NO COMMENTS
periodicWarn 131072ull periodic severity warning NO COMMENTS
minCrit 134217728ull min severity critical NO COMMENTS
avgLow 137438953472ull avg crossed low threshold NO COMMENTS
trendMajor 140737488355328ull trend severity major NO COMMENTS
periodicRecovering 16384ull periodic recovering NO COMMENTS
minWarn 16777216ull min severity warning NO COMMENTS
lastReadingMinor 16ull lastReading severity minor NO COMMENTS
maxCrit 17179869184ull max severity critical NO COMMENTS
trendLow 17592186044416ull trend crossed low threshold NO COMMENTS
rateMajor 18014398509481984ull rate severity major NO COMMENTS
lastReadingRecovering 1ull lastReading recovering NO COMMENTS
cumulativeMinor 2048ull cumulative severity minor NO COMMENTS
minRecovering 2097152ull min recovering NO COMMENTS
maxWarn 2147483648ull max severity warning NO COMMENTS
avgCrit 2199023255552ull avg severity critical NO COMMENTS
rateLow 2251799813685248ull rate crossed low threshold NO COMMENTS
cumulativeHigh 256ull cumulative crossed high threshold NO COMMENTS
periodicMinor 262144ull periodic severity minor NO COMMENTS
maxRecovering 268435456ull max recovering NO COMMENTS
avgWarn 274877906944ull avg severity warning NO COMMENTS
trendCrit 281474976710656ull trend severity critical NO COMMENTS
lastReadingHigh 2ull lastReading crossed high threshold NO COMMENTS
periodicHigh 32768ull periodic crossed high threshold NO COMMENTS
lastReadingMajor 32ull lastReading severity major NO COMMENTS
minMinor 33554432ull min severity minor NO COMMENTS
avgRecovering 34359738368ull avg recovering NO COMMENTS
trendWarn 35184372088832ull trend severity warning NO COMMENTS
rateCrit 36028797018963968ull rate severity critical NO COMMENTS
cumulativeMajor 4096ull cumulative severity major NO COMMENTS
minHigh 4194304ull min crossed high threshold NO COMMENTS
maxMinor 4294967296ull max severity minor NO COMMENTS
trendRecovering 4398046511104ull trend recovering NO COMMENTS
rateWarn 4503599627370496ull rate severity warning NO COMMENTS
lastReadingLow 4ull lastReading crossed low threshold NO COMMENTS
cumulativeLow 512ull cumulative crossed low threshold NO COMMENTS
periodicMajor 524288ull periodic severity major NO COMMENTS
maxHigh 536870912ull max crossed high threshold NO COMMENTS
avgMinor 549755813888ull avg severity minor NO COMMENTS
rateRecovering 562949953421312ull rate recovering NO COMMENTS
lastReadingCrit 64ull lastReading severity critical NO COMMENTS
periodicLow 65536ull periodic crossed low threshold NO COMMENTS
minMajor 67108864ull min severity major NO COMMENTS
avgHigh 68719476736ull avg crossed high threshold NO COMMENTS
trendMinor 70368744177664ull trend severity minor NO COMMENTS
cumulativeCrit 8192ull cumulative severity critical NO COMMENTS
minLow 8388608ull min crossed low threshold NO COMMENTS
maxMajor 8589934592ull max severity major NO COMMENTS
trendHigh 8796093022208ull trend crossed high threshold NO COMMENTS
lastReadingWarn 8ull lastReading severity warning NO COMMENTS
rateMinor 9007199254740992ull rate severity minor NO COMMENTS
DEFAULT unspecified(0ull) --- NO COMMENTS


bucket15Tr

Type: scalar:Sint64

Units: packets
Encrypted: false
Access: oper
Category: ImplicitTrend
    Comments:
Packets within the 16th bucket. This is the trending value of the counter. Note that this value resets to 0 at the beginning of each interval.


bucket15TrBase

Type: scalar:Uint64

Units: packets
Encrypted: false
Access: oper
Category: ImplicitTrendBase
    Comments:
Packets within the 16th bucket. This is the cumulative value of the counter from the previous collection interval. Used for internal purposes.


childAction

Type: mo:ModificationChildAction
Primitive Type: scalar:Bitmask32

Units: null
Encrypted: false
Access: implicit
Category: TopLevelChildAction
    Comments:
Delete or ignore. For internal use only.
Constants
deleteAll 16384u deleteAll NO COMMENTS
ignore 4096u ignore NO COMMENTS
deleteNonPresent 8192u deleteNonPresent NO COMMENTS
DEFAULT 0 --- This type is used to


cnt

Type: scalar:Uint16

Units: null
Encrypted: false
Access: implicit
Category: TopLevelRegular
    Comments:
The number of readings made within the current sample.


dn

Type: reference:BinRef

Units: null
Encrypted: false
Access: implicit
Category: TopLevelDn
    Comments:
A tag or metadata is a non-hierarchical keyword or term assigned to the fabric module.


lastCollOffset

Type: scalar:Uint32

Units: null
Encrypted: false
Access: implicit
Category: TopLevelRegular
    Comments:


modTs

Type: mo:TStamp
Primitive Type: scalar:Date

Units: null
Encrypted: false
Access: implicit
Category: TopLevelRegular
    Comments:
The time when this object was last modified.
Constants
never 0ull never NO COMMENTS
DEFAULT never(0ull) never NO COMMENTS


repIntvEnd

Type: scalar:Date

Units: null
Encrypted: false
Access: implicit
Category: TopLevelRegular
    Comments:


repIntvStart

Type: scalar:Date

Units: null
Encrypted: false
Access: implicit
Category: TopLevelRegular
    Comments:


rn

Type: reference:BinRN

Units: null
Encrypted: false
Access: implicit
Category: TopLevelRn
    Comments:
Identifies an object from its siblings within the context of its parent object. The distinguished name contains a sequence of relative names.


status

Type: mo:ModificationStatus
Primitive Type: scalar:Bitmask32

Units: null
Encrypted: false
Access: implicit
Category: TopLevelStatus
    Comments:
The upgrade status. This property is for internal use only.
Constants
created 2u created In a setter method: specifies that an object should be created. An error is returned if the object already exists.
In the return value of a setter method: indicates that an object has been created.
modified 4u modified In a setter method: specifies that an object should be modified
In the return value of a setter method: indicates that an object has been modified.
deleted 8u deleted In a setter method: specifies that an object should be deleted.
In the return value of a setter method: indicates that an object has been deleted.
DEFAULT 0 --- This type controls the life cycle of objects passed in the XML API.

When used in a setter method (such as configConfMo), the ModificationStatus specifies whether an object should be created, modified, deleted or removed.
In the return value of a setter method, the ModificationStatus indicates the actual operation that was performed. For example, the ModificationStatus is set to "created" if the object was created. The ModificationStatus is not set if the object was neither created, modified, deleted or removed.

When invoking a setter method, the ModificationStatus is optional:
If a setter method such as configConfMo is invoked and the ModificationStatus is not set, the system automatically determines if the object should be created or modified.


totalBucket0Avg

Type: scalar:Uint64

Units: packets
Encrypted: false
Access: oper
Category: ImplicitAvg
    Comments:
Packets within the 1st bucket. This is the average value read by the counter during the collection interval. Note that this value resets to 0 at the beginning of each interval.


totalBucket0Base

Type: scalar:Uint64

Units: packets
Encrypted: false
Access: oper
Category: ImplicitBaseline
    Comments:
Packets within the 1st bucket. This is the cumulative value of the counter after the last reset of the hardware counter. Note that this value continues through each interval without resetting to zero. Used for internal purposes.


totalBucket0Cum

Type: scalar:Uint64

Units: packets
Encrypted: false
Access: oper
Category: ImplicitCumulative
    Comments:
Packets within the 1st bucket. The total sum of the values read. Note that this value continues through each interval without resetting to zero.


totalBucket0Last

Type: scalar:Uint64

Units: packets
Encrypted: false
Access: oper
Category: ImplicitLastReading
    Comments:
Packets within the 1st bucket. This is the most current value read by the counter.


totalBucket0Max

Type: scalar:Uint64

Units: packets
Encrypted: false
Access: oper
Category: ImplicitMax
    Comments:
Packets within the 1st bucket. This is the largest value read by the counter during the collection interval. This value is only overwritten if the most current value is larger than the previous value. For example, if the value of the first reading is 3 and the value of the second reading is 4, the previous value is overwritten with 4. If the third reading is smaller than 4, the value remains at 4. Note that this value resets to 0 at the beginning of each interval.


totalBucket0Min

Type: scalar:Uint64

Units: packets
Encrypted: false
Access: oper
Category: ImplicitMin
    Comments:
Packets within the 1st bucket. This is the smallest value read by the counter during the collection interval. This value is only overwritten if the most current value is smaller than the previous value. For example, if the value of the first reading is 3 and the value of the second reading is 2, the previous value is overwritten with 2. If the third reading is larger than 2, the value remains at 2. Note that this value resets to 0 at the beginning of each interval.


totalBucket0Per

Type: scalar:Uint64

Units: packets
Encrypted: false
Access: oper
Category: ImplicitPeriodic
    Comments:
Packets within the 1st bucket. The total sum of the values read during the collection interval. Note that this value resets to 0 at the beginning of each interval.


totalBucket0Rate

Type: scalar:Double

Units: packets
Encrypted: false
Access: oper
Category: ImplicitRate
    Comments:
Packets within the 1st bucket. This is the rate of the counter during the collection interval. The rate is calculated by dividing the periodic value by the length of the collection interval. Note that this value resets to 0 at the beginning of each interval.


totalBucket0Spct

Type: scalar:Uint16

Units: packets
Encrypted: false
Access: oper
Category: ImplicitSuspect
    Comments:
Packets within the 1st bucket. This is the number of missed and/or incorrect values read by the counter during the collection interval. Note that this value resets to 0 at the beginning of each interval.


totalBucket0Thr

Type: stats:ThresholdedMask
Primitive Type: scalar:Bitmask64

Units: packets
Encrypted: false
Access: oper
Category: ImplicitThresholded
    Comments:
Packets within the 1st bucket. This indicates the properties of the counter that crossed the threshold during the collection interval. Note that this value resets at the beginning of each interval.
Constants
unspecified 0ull --- NO COMMENTS
cumulativeWarn 1024ull cumulative severity warning NO COMMENTS
periodicCrit 1048576ull periodic severity critical NO COMMENTS
maxLow 1073741824ull max crossed low threshold NO COMMENTS
avgMajor 1099511627776ull avg severity major NO COMMENTS
rateHigh 1125899906842624ull rate crossed high threshold NO COMMENTS
cumulativeRecovering 128ull cumulative recovering NO COMMENTS
periodicWarn 131072ull periodic severity warning NO COMMENTS
minCrit 134217728ull min severity critical NO COMMENTS
avgLow 137438953472ull avg crossed low threshold NO COMMENTS
trendMajor 140737488355328ull trend severity major NO COMMENTS
periodicRecovering 16384ull periodic recovering NO COMMENTS
minWarn 16777216ull min severity warning NO COMMENTS
lastReadingMinor 16ull lastReading severity minor NO COMMENTS
maxCrit 17179869184ull max severity critical NO COMMENTS
trendLow 17592186044416ull trend crossed low threshold NO COMMENTS
rateMajor 18014398509481984ull rate severity major NO COMMENTS
lastReadingRecovering 1ull lastReading recovering NO COMMENTS
cumulativeMinor 2048ull cumulative severity minor NO COMMENTS
minRecovering 2097152ull min recovering NO COMMENTS
maxWarn 2147483648ull max severity warning NO COMMENTS
avgCrit 2199023255552ull avg severity critical NO COMMENTS
rateLow 2251799813685248ull rate crossed low threshold NO COMMENTS
cumulativeHigh 256ull cumulative crossed high threshold NO COMMENTS
periodicMinor 262144ull periodic severity minor NO COMMENTS
maxRecovering 268435456ull max recovering NO COMMENTS
avgWarn 274877906944ull avg severity warning NO COMMENTS
trendCrit 281474976710656ull trend severity critical NO COMMENTS
lastReadingHigh 2ull lastReading crossed high threshold NO COMMENTS
periodicHigh 32768ull periodic crossed high threshold NO COMMENTS
lastReadingMajor 32ull lastReading severity major NO COMMENTS
minMinor 33554432ull min severity minor NO COMMENTS
avgRecovering 34359738368ull avg recovering NO COMMENTS
trendWarn 35184372088832ull trend severity warning NO COMMENTS
rateCrit 36028797018963968ull rate severity critical NO COMMENTS
cumulativeMajor 4096ull cumulative severity major NO COMMENTS
minHigh 4194304ull min crossed high threshold NO COMMENTS
maxMinor 4294967296ull max severity minor NO COMMENTS
trendRecovering 4398046511104ull trend recovering NO COMMENTS
rateWarn 4503599627370496ull rate severity warning NO COMMENTS
lastReadingLow 4ull lastReading crossed low threshold NO COMMENTS
cumulativeLow 512ull cumulative crossed low threshold NO COMMENTS
periodicMajor 524288ull periodic severity major NO COMMENTS
maxHigh 536870912ull max crossed high threshold NO COMMENTS
avgMinor 549755813888ull avg severity minor NO COMMENTS
rateRecovering 562949953421312ull rate recovering NO COMMENTS
lastReadingCrit 64ull lastReading severity critical NO COMMENTS
periodicLow 65536ull periodic crossed low threshold NO COMMENTS
minMajor 67108864ull min severity major NO COMMENTS
avgHigh 68719476736ull avg crossed high threshold NO COMMENTS
trendMinor 70368744177664ull trend severity minor NO COMMENTS
cumulativeCrit 8192ull cumulative severity critical NO COMMENTS
minLow 8388608ull min crossed low threshold NO COMMENTS
maxMajor 8589934592ull max severity major NO COMMENTS
trendHigh 8796093022208ull trend crossed high threshold NO COMMENTS
lastReadingWarn 8ull lastReading severity warning NO COMMENTS
rateMinor 9007199254740992ull rate severity minor NO COMMENTS
DEFAULT unspecified(0ull) --- NO COMMENTS


totalBucket0Tr

Type: scalar:Sint64

Units: packets
Encrypted: false
Access: oper
Category: ImplicitTrend
    Comments:
Packets within the 1st bucket. This is the trending value of the counter. Note that this value resets to 0 at the beginning of each interval.


totalBucket0TrBase

Type: scalar:Uint64

Units: packets
Encrypted: false
Access: oper
Category: ImplicitTrendBase
    Comments:
Packets within the 1st bucket. This is the cumulative value of the counter from the previous collection interval. Used for internal purposes.


totalBucket1Avg

Type: scalar:Uint64

Units: packets
Encrypted: false
Access: oper
Category: ImplicitAvg
    Comments:
Packets within the 2nd bucket. This is the average value read by the counter during the collection interval. Note that this value resets to 0 at the beginning of each interval.


totalBucket1Base

Type: scalar:Uint64

Units: packets
Encrypted: false
Access: oper
Category: ImplicitBaseline
    Comments:
Packets within the 2nd bucket. This is the cumulative value of the counter after the last reset of the hardware counter. Note that this value continues through each interval without resetting to zero. Used for internal purposes.


totalBucket1Cum

Type: scalar:Uint64

Units: packets
Encrypted: false
Access: oper
Category: ImplicitCumulative
    Comments:
Packets within the 2nd bucket. The total sum of the values read. Note that this value continues through each interval without resetting to zero.


totalBucket1Last

Type: scalar:Uint64

Units: packets
Encrypted: false
Access: oper
Category: ImplicitLastReading
    Comments:
Packets within the 2nd bucket. This is the most current value read by the counter.


totalBucket1Max

Type: scalar:Uint64

Units: packets
Encrypted: false
Access: oper
Category: ImplicitMax
    Comments:
Packets within the 2nd bucket. This is the largest value read by the counter during the collection interval. This value is only overwritten if the most current value is larger than the previous value. For example, if the value of the first reading is 3 and the value of the second reading is 4, the previous value is overwritten with 4. If the third reading is smaller than 4, the value remains at 4. Note that this value resets to 0 at the beginning of each interval.


totalBucket1Min

Type: scalar:Uint64

Units: packets
Encrypted: false
Access: oper
Category: ImplicitMin
    Comments:
Packets within the 2nd bucket. This is the smallest value read by the counter during the collection interval. This value is only overwritten if the most current value is smaller than the previous value. For example, if the value of the first reading is 3 and the value of the second reading is 2, the previous value is overwritten with 2. If the third reading is larger than 2, the value remains at 2. Note that this value resets to 0 at the beginning of each interval.


totalBucket1Per

Type: scalar:Uint64

Units: packets
Encrypted: false
Access: oper
Category: ImplicitPeriodic
    Comments:
Packets within the 2nd bucket. The total sum of the values read during the collection interval. Note that this value resets to 0 at the beginning of each interval.


totalBucket1Rate

Type: scalar:Double

Units: packets
Encrypted: false
Access: oper
Category: ImplicitRate
    Comments:
Packets within the 2nd bucket. This is the rate of the counter during the collection interval. The rate is calculated by dividing the periodic value by the length of the collection interval. Note that this value resets to 0 at the beginning of each interval.


totalBucket1Spct

Type: scalar:Uint16

Units: packets
Encrypted: false
Access: oper
Category: ImplicitSuspect
    Comments:
Packets within the 2nd bucket. This is the number of missed and/or incorrect values read by the counter during the collection interval. Note that this value resets to 0 at the beginning of each interval.


totalBucket1Thr

Type: stats:ThresholdedMask
Primitive Type: scalar:Bitmask64

Units: packets
Encrypted: false
Access: oper
Category: ImplicitThresholded
    Comments:
Packets within the 2nd bucket. This indicates the properties of the counter that crossed the threshold during the collection interval. Note that this value resets at the beginning of each interval.
Constants
unspecified 0ull --- NO COMMENTS
cumulativeWarn 1024ull cumulative severity warning NO COMMENTS
periodicCrit 1048576ull periodic severity critical NO COMMENTS
maxLow 1073741824ull max crossed low threshold NO COMMENTS
avgMajor 1099511627776ull avg severity major NO COMMENTS
rateHigh 1125899906842624ull rate crossed high threshold NO COMMENTS
cumulativeRecovering 128ull cumulative recovering NO COMMENTS
periodicWarn 131072ull periodic severity warning NO COMMENTS
minCrit 134217728ull min severity critical NO COMMENTS
avgLow 137438953472ull avg crossed low threshold NO COMMENTS
trendMajor 140737488355328ull trend severity major NO COMMENTS
periodicRecovering 16384ull periodic recovering NO COMMENTS
minWarn 16777216ull min severity warning NO COMMENTS
lastReadingMinor 16ull lastReading severity minor NO COMMENTS
maxCrit 17179869184ull max severity critical NO COMMENTS
trendLow 17592186044416ull trend crossed low threshold NO COMMENTS
rateMajor 18014398509481984ull rate severity major NO COMMENTS
lastReadingRecovering 1ull lastReading recovering NO COMMENTS
cumulativeMinor 2048ull cumulative severity minor NO COMMENTS
minRecovering 2097152ull min recovering NO COMMENTS
maxWarn 2147483648ull max severity warning NO COMMENTS
avgCrit 2199023255552ull avg severity critical NO COMMENTS
rateLow 2251799813685248ull rate crossed low threshold NO COMMENTS
cumulativeHigh 256ull cumulative crossed high threshold NO COMMENTS
periodicMinor 262144ull periodic severity minor NO COMMENTS
maxRecovering 268435456ull max recovering NO COMMENTS
avgWarn 274877906944ull avg severity warning NO COMMENTS
trendCrit 281474976710656ull trend severity critical NO COMMENTS
lastReadingHigh 2ull lastReading crossed high threshold NO COMMENTS
periodicHigh 32768ull periodic crossed high threshold NO COMMENTS
lastReadingMajor 32ull lastReading severity major NO COMMENTS
minMinor 33554432ull min severity minor NO COMMENTS
avgRecovering 34359738368ull avg recovering NO COMMENTS
trendWarn 35184372088832ull trend severity warning NO COMMENTS
rateCrit 36028797018963968ull rate severity critical NO COMMENTS
cumulativeMajor 4096ull cumulative severity major NO COMMENTS
minHigh 4194304ull min crossed high threshold NO COMMENTS
maxMinor 4294967296ull max severity minor NO COMMENTS
trendRecovering 4398046511104ull trend recovering NO COMMENTS
rateWarn 4503599627370496ull rate severity warning NO COMMENTS
lastReadingLow 4ull lastReading crossed low threshold NO COMMENTS
cumulativeLow 512ull cumulative crossed low threshold NO COMMENTS
periodicMajor 524288ull periodic severity major NO COMMENTS
maxHigh 536870912ull max crossed high threshold NO COMMENTS
avgMinor 549755813888ull avg severity minor NO COMMENTS
rateRecovering 562949953421312ull rate recovering NO COMMENTS
lastReadingCrit 64ull lastReading severity critical NO COMMENTS
periodicLow 65536ull periodic crossed low threshold NO COMMENTS
minMajor 67108864ull min severity major NO COMMENTS
avgHigh 68719476736ull avg crossed high threshold NO COMMENTS
trendMinor 70368744177664ull trend severity minor NO COMMENTS
cumulativeCrit 8192ull cumulative severity critical NO COMMENTS
minLow 8388608ull min crossed low threshold NO COMMENTS
maxMajor 8589934592ull max severity major NO COMMENTS
trendHigh 8796093022208ull trend crossed high threshold NO COMMENTS
lastReadingWarn 8ull lastReading severity warning NO COMMENTS
rateMinor 9007199254740992ull rate severity minor NO COMMENTS
DEFAULT unspecified(0ull) --- NO COMMENTS


totalBucket1Tr

Type: scalar:Sint64

Units: packets
Encrypted: false
Access: oper
Category: ImplicitTrend
    Comments:
Packets within the 2nd bucket. This is the trending value of the counter. Note that this value resets to 0 at the beginning of each interval.


totalBucket1TrBase

Type: scalar:Uint64

Units: packets
Encrypted: false
Access: oper
Category: ImplicitTrendBase
    Comments:
Packets within the 2nd bucket. This is the cumulative value of the counter from the previous collection interval. Used for internal purposes.